
AVIOR INSIGHTS – What Mixed Market and Economic Signals Mean for Investors
In many ways, the current investment environment may be one of the most challenging in years due to a variety of mixed signals. While analyzing economic data in the right context is always difficult, many of today’s market and economic factors can be interpreted as being either good and bad, depending on one’s perspective and priorities. For instance, another major event last week was the Fed raising rates by 75 basis points for the second time in as many meetings. While tighter monetary policy is usually a bad sign for the economy, major indices have rallied in response to the Fed combating inflation.
Business investment and inventories were drags on GDP in Q2
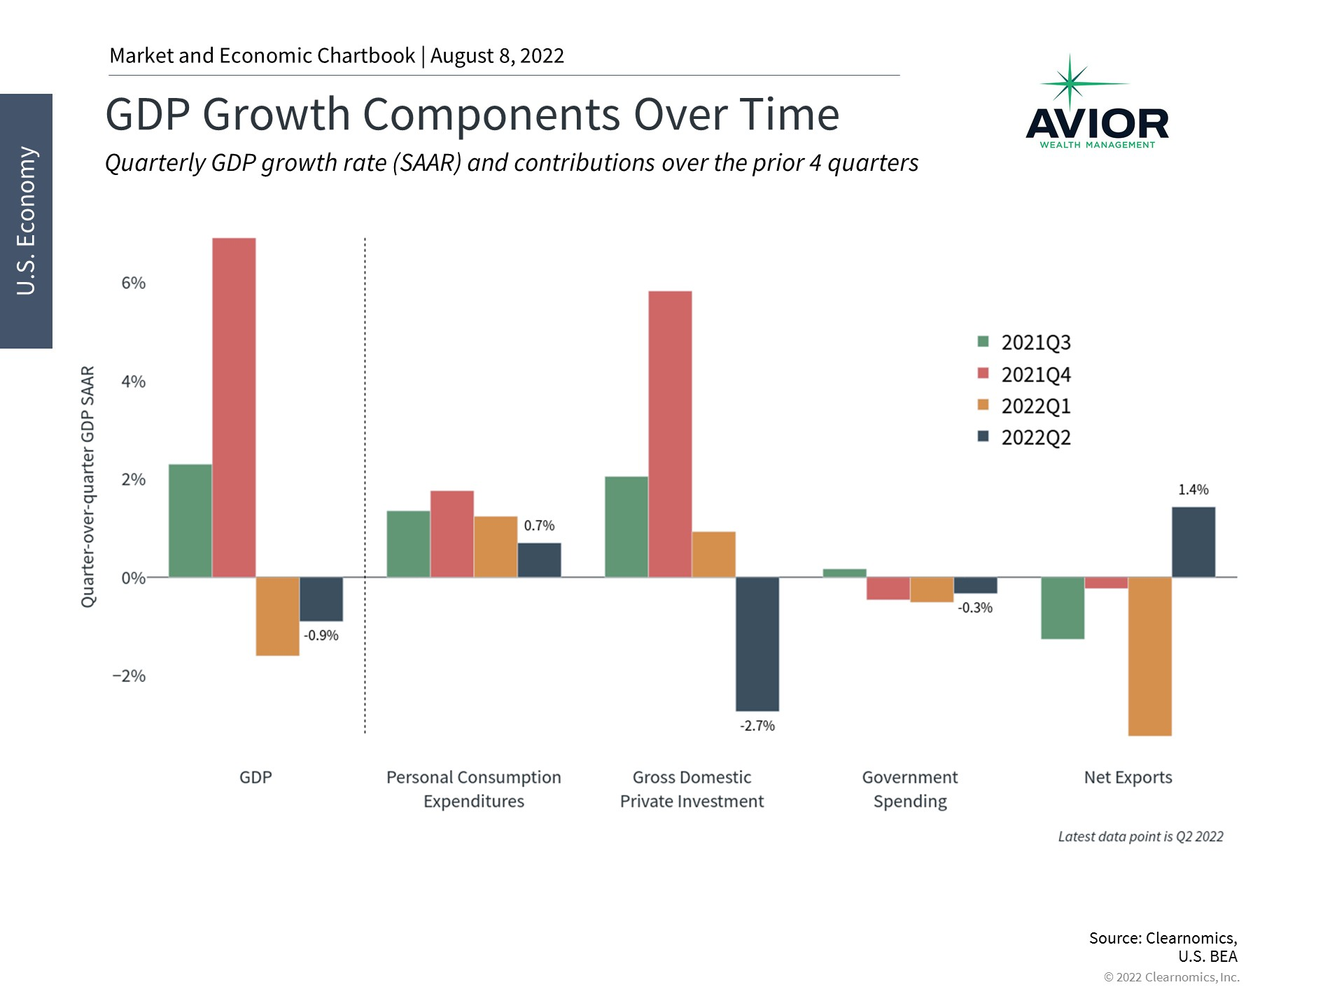
GDP Growth Components Over time
Similarly, slower economic growth and an inverted yield curve would normally be negative for the stock market. However, growth that is only moderately slower, but that helps to ease supply and demand pressures on inflation, can be positive. These data have pulled the 10-year Treasury yield back to around 2.65% from near 3% only a month ago, and many other interest rates, including mortgage rates, have fallen as well. Perhaps more interestingly, the S&P 500 rallied 9.1% in July and has rebounded 12.6% since the middle of June following the Fed meeting that month.
This is another reminder to long-term investors that markets can rebound when it’s least expected. In this context, there are a few ways in which investors can interpret the latest GDP numbers. First, does this mean that we’re in a recession? While some consider two consecutive quarters of negative growth to be a recession, sometimes referred to as a “technical recession,” the official definition from the National Bureau of Economic Research is more nuanced and considers a variety of data beyond GDP.
Although growth is negative, many other indicators, especially within the labor market, are still quite strong. Over 1.1 million net new jobs were created during the second quarter, bringing the year-to-date total to 2.7 million jobs. There are still 11.3 million job openings, near the historic peak, which suggests that many companies would still like to hire and expand. So, while some investors and the news media may enjoy debating the meaning of the term “recession,” such strong job dynamics are not consistent with historical economic contractions.
Second, it’s also important to keep the negative growth rates of the first half of the year in perspective. While the first and second quarters shrank by 1.6% and 0.9%, respectively, these are small declines compared to historical recessions. In fact, the chart above shows that these are some of the smallest on record and are dwarfed by the recessions of 2020, 2008, and others. This chart also highlights how many more positive quarters there have been over the past 75 years compared to negative ones, even though the latter are what garner most of the attention.
A stronger dollar naturally tightens economic conditions
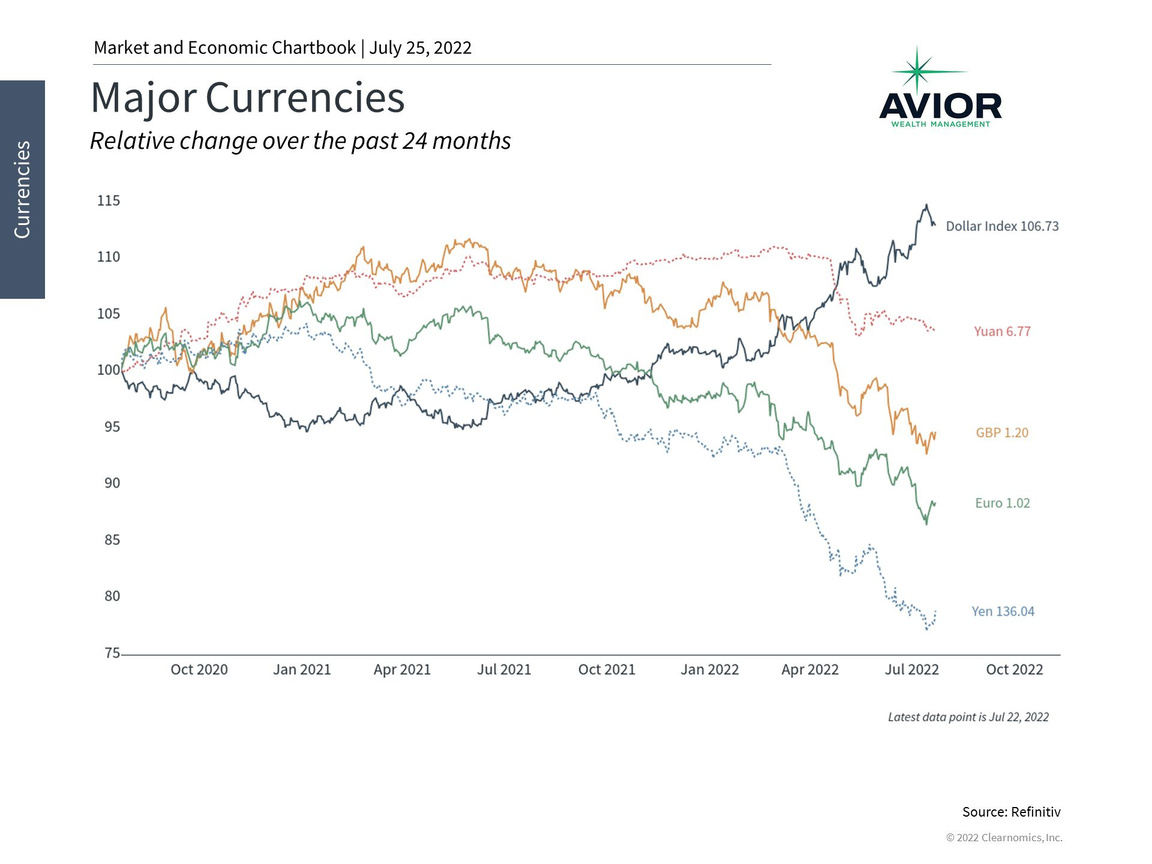
First, a strong dollar is great news for American travelers and consumers buying foreign goods who will find that their currency goes much further. This naturally lowers inflation since the prices that consumers pay will decline. In theory, a stronger dollar and lowers oil prices, since the commodity is mostly denominated in U.S. dollars.
Second, a strong dollar also slows the economy somewhat since foreign buyers will find U.S. dollar-denominated products more expensive. This can also drive down inflation since there will be less demand for certain goods and services. Thus, a stronger dollar naturally tightens financial and economic conditions which may slow the economy, but perhaps more importantly combats inflation.
Business investment and inventories were drags on GDP in Q2
GDP Growth Components Over Time
It’s also important to keep in mind that the numbers are reported as annual rates. Thus, what 0.9% means is that the economy would have shrunk by this amount had the same trends continued for a full year. In reality, the economy only shrank by a quarter of this amount. Additionally, the GDP numbers are calculated to be in “real” terms, i.e. they subtract the effects of inflation. In “nominal” terms, i.e. with inflationary trends, GDP actually grew by 6.6% in the first quarter and 7.8% in the second quarter.
Third, while there were slowdowns across the board, including in consumer spending, the biggest detractor in the second quarter was a drop in private inventories among businesses. An important component of the business cycle is the inventory cycle since businesses don’t simply produce everything “just-in-time.” Instead, they need to anticipate future demand and may accumulate inventory. When businesses build up inventories, this boosts economic growth in those quarters at the expense of future periods when they draw down those inventories.
This is exactly what happened in the second quarter. In contrast, the second half of last year experienced a strong build-up of inventories which contributed 2.2 and 5.3 percentage points of GDP growth in Q3 and Q4 2021, respectively, as businesses anticipated high demand. The chart above shows that “Gross Domestic Private Investment” detracted from GDP in Q2, and the biggest contributor of that was a two percentage point decrease from private inventories.
The market has rallied significantly since mid-June
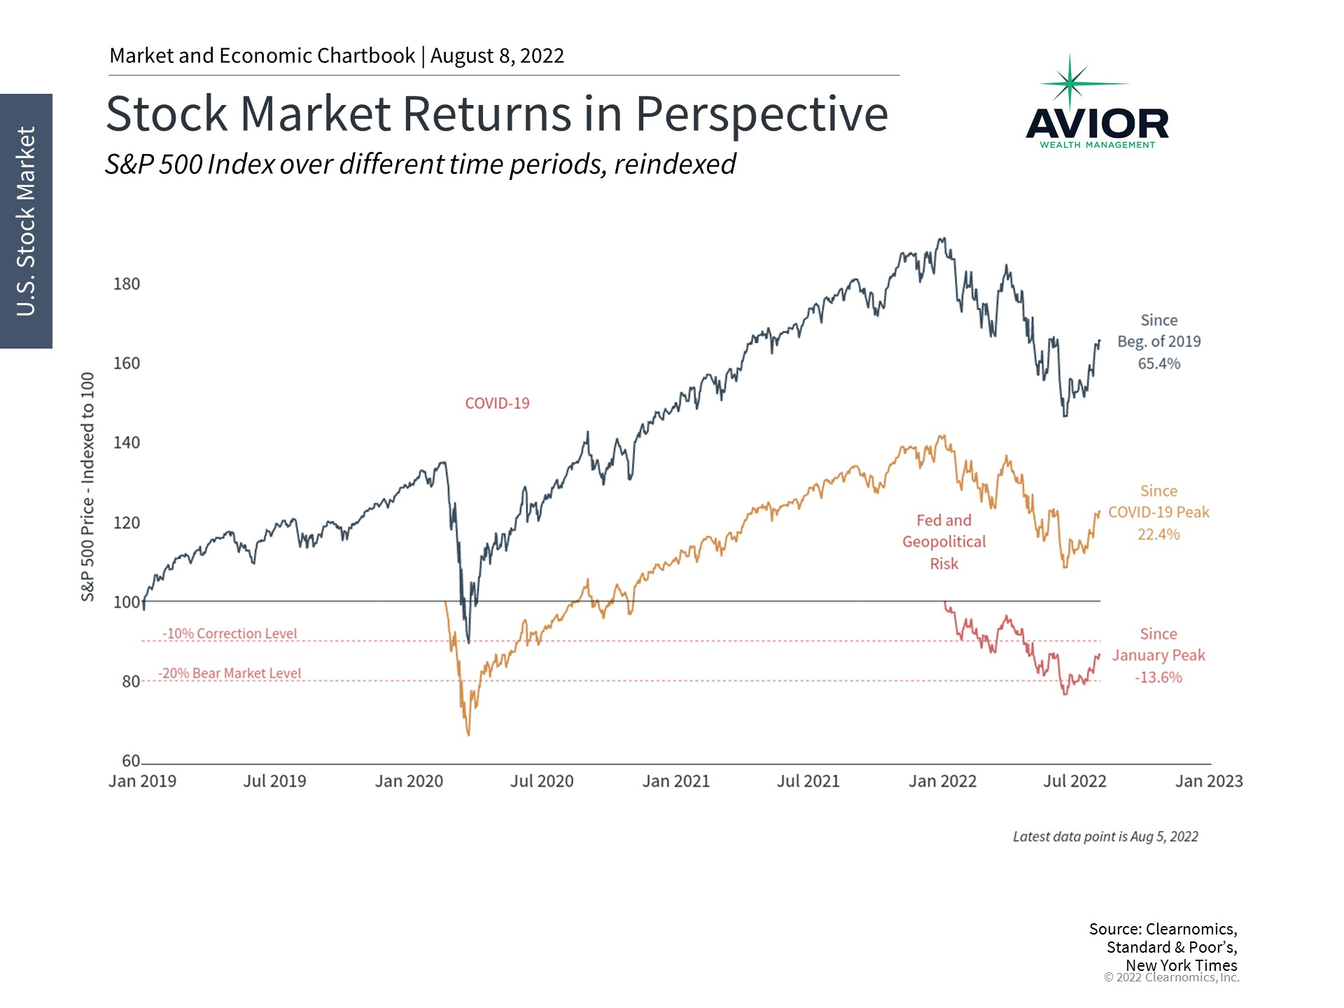
Stock Market Returns in Perspective
None of this discussion is meant to make excuses for a slowing economy. However, it does underscore the importance of not focusing on any individual economic report or trying to time the market based on these numbers. The fact that the S&P 500 has bounced off of bear market levels, despite all of these seemingly negative events, suggests that there can be many ways to interpret these data. At the moment, the market appears to be most focused on fighting inflation. If price pressures do begin to ease later this year, this could be taken as a positive sign.
The bottom line? Investors ought to maintain a broad perspective and not focus too much on any particular data point. Staying diversified while also properly positioning to take advantage of an eventual recovery are the best ways investors can increase their odds of financial success.
Avior Wealth Management, LLC, 14301 FNB Pkwy, Suite 110, Omaha, Nebraska 68154, United States, 402-810-7831


No Comments
Sorry, the comment form is closed at this time.